By Allen Arender, EVP – Development (Nashville, TN)
As a commercial real estate company, our success is closely tied to the performance of the economy. Often times some “micro” locations within a city outperform the “macro” economy of the entire United States. However, as a general rule, economic growth is good for us and our industry, and this growth is most widely measured by GDP. As we recover from the Great Recession, there has been a lot of focus on these growth metrics, with “real-time” feedback on all types of economic indicators. A few recent headlines include:
- Factory Orders Slip Roughly In Line With Expectations
- Construction Spending Rises Modestly in March
- Durable Goods Orders Plunge in March
- ISM Manufacturing index indicates faster expansion in April
- New Home Sales Drop More than Expected in March
It is apparent that these indicators have tremendous variability, some are good, some bad, and in the end, we hope the economy keeps growing.
One recent topic has been concern of whether we are heading into a 3rd spring slowdown in a row. The other event synonymous with every spring is the start of baseball season. The weather warms up, flowers bloom, the environment comes alive.
Trying to decipher the economic indicators can be difficult, but wins and losses are easy to see. Which brings this to my favorite baseball team, the Atlanta Braves, and the obvious question of –Is the success of Braves baseball and indicator of economic prosperity? Remarkably, I think it is!
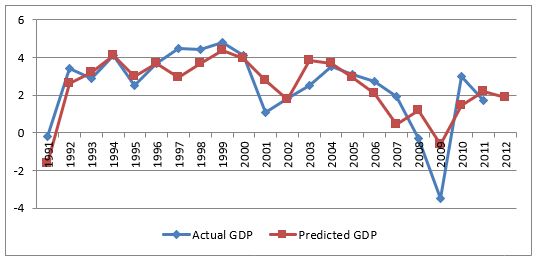
I looked at the Braves’ winning percentage history from 1990 to 2011 and compared this to the following year’s GDP. Using some wiz-bang statistics, I discovered an exciting new proxy for economic health. When the Braves do well, so does the economy in the following year, and vice-versa. For the statisticians reading this, I got an R-squared of 80%, and a residual sum of squares of 26!…
Note how closely the graph tracks actual vs. predicted GDP:

Here’s the formula:
Next Year GDP = 23.80591087 x BravesWinning% – 11.17661494
Based on the Braves’ 0.549 winning percentage of 2011 (89 wins out of 162 games), the model predicts 2012 GDP growth of 1.9%.
So, what does it mean”¦. We should all become big Braves fans and watch their performance drive growth and prosperity in our economy. The higher the Braves winning %, the higher GDP will go! Let’s hope for a 100 win season this year, which will bring 2013 GDP of 3.0%.
Footnote: I checked the Chicago Cubs correlation, and they are so consistently bad there was no fit in the model. I don’t believe they have made it out of the Great Depression”¦
